Now you can see how your campaigns stack up against competitors in your same verticals with a new feature added to the Opportunities tab in the AdWords interface.
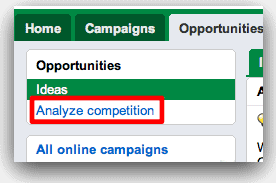
To use it, click “Analyze Competition” on the Opportunities tab.
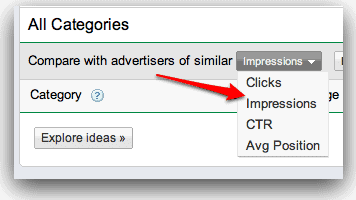
You can choose to compare your account to others in your categories by way of four metrics: clicks, impressions, CTR, or average position.
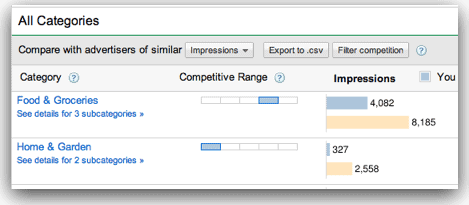
Graphs show you your competitive position in the high level categories in which Google thinks your campaigns operate. Most categories also have drill-downs to sub-categories. The tan bar in each graph shows the average for all advertisers in your range (range explained below).
Competitive Range
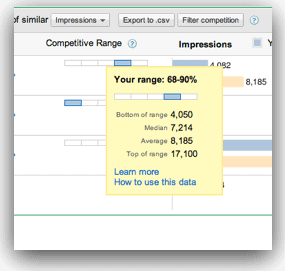
Perhaps the most important part of the Analyze Competition feature to understand is the Competitive Range metric. In order to show you more accurately your place in the competitive spectrum, Google first places you in each category within one of five ranges of advertisers. The farther to the right the blue part of the rectangle shows, the higher range of competitors you fall into. Hovering your mouse over the Competitive Range graph brings up a tooltip with metrics for that range.
As explained in the Google video at the beginning of this post, there are several ways you can use this data:
- Determine whether your performance is “normal” for a given metric
- Identify potentially weak campaigns in need of optimization.
- Understand where Google may have mis-categorized your account and delete irrelevant keywords.
- Identify new opportunities for growth.

