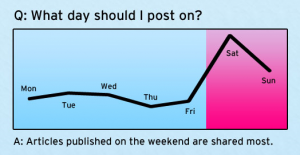
 Judging by a number of studies I looked at, the answer might be, “Who knows?”
Here are several that give divergent answers on both time of day and day of the week:
blogcampaigning.com | allfacebook.com | smthree’s blog (study on conversation volume, not likes/shares)
Each of these studies has its value, but any Facebook Page owner should approach them with a grain of salt ready at hand. They are based on samples taken from widely divergent types of Pages, and the cliche “your mileage may vary” is very much applicable. Your business niche, your audience, and many other factors will determine when fans of your page are most inclined to read, like, and share your posts.
For example, one of the studies above concludes that Sunday is the day when the most sharing occurs. However, I consult with a religious non-profit organization. They have 6,000 very active fans on their Facebook page, but Sundays are the worst days for garnering shares in their case, for the obvious reason that many religious people shy away from “worldly” activities like the Internet on their day of worship.
Bottom line: Test for Yourself!
Experiment with your Page posts continually. Try all different days and hours. Then watch your metrics. Find out what gets the best results for you. And test not only different days and times, but also frequency. How much does how often you post (and/or re-post) affect interaction from your fans?
Facebook Insight for Pages will give you basic metrics about the levels of interactivity of your fans with your page, but it doesn’t tell you how much your material is being shared. Later this week I’ll explain how to set up “Insights for your Domain,” a little know Facebook feature that lets you see exactly what is being shared from your page, and how much.


